It is long past time to provide my best election forecast model. We last visited the topic several months ago.
Forecasting the American presidential election, part 2
In February, I introduced you to my most simplistic forecast of the American presidential election, the only one of my forecasts that can run prior to the election year itself. Here is a link to the previous installment.
The earlier models made use of two major ingredients:
The first model employed only the 16-year cycle that has dominated presidential politics since 1904. With very few exceptions, it has successfully predicted two Republican victories followed by two Democrat victories. Any violation of this cycle (Reagan in 1980, Biden in 2020) does not reset the cycle. Rather, the cycle continues relentlessly. This is my best predictor prior to the election year. This year, the advantage goes to the Democrat nominee. (A tiny adjustment must be made to improve the accuracy of the model: an acknowledgement that Republican incumbents are at a slight disadvantage for re-election.)
The second model combined the 16-year cycle with some economic information about the last quarter of the year prior to the election year. That information was discussed in the previous article. It becomes available around the end of January during the election year, and somewhat improves the precision of the forecast. This variable is also favorable to Democrats this year.
The next model will be described in this article. It employs the previous ingredients, plus one more important ingredient: the difference in the share of the cumulative primary vote earned by the eventual nominees of the two major parties. Since an incumbent president is usually not challenged for re-election within his own party, this reinforces the 16-year cycle discussed above.
This year, Joe Biden attained about an 11% greater share of Democrat primary voters, compared to Donald Trump’s share among Republican primary voters, which is yet another variable favorable to Democrats this year. Overall, putting all the pieces together, the model predicts a 13.3% blowout for Democrats in the national popular vote - a memorable landslide. (For statistical insiders, the standard deviation of forecast errors in my best model from 1952 to 2016 was a low 3.9%, with adjusted R-squared a high 86.3%.)
BUT WAIT! Joe Biden is not the Democrat nominee! Kamala Harris is the Democrat nominee. Her share of primary votes is zero. If that number is changed in the model, the forecast changes as well, because now Trump has the advantage in terms of primary vote share. Indeed, the model predicts that Harris earns only a 2.4% margin in the national popular vote. That is a narrow enough margin so that Trump could still win in the Electoral College.
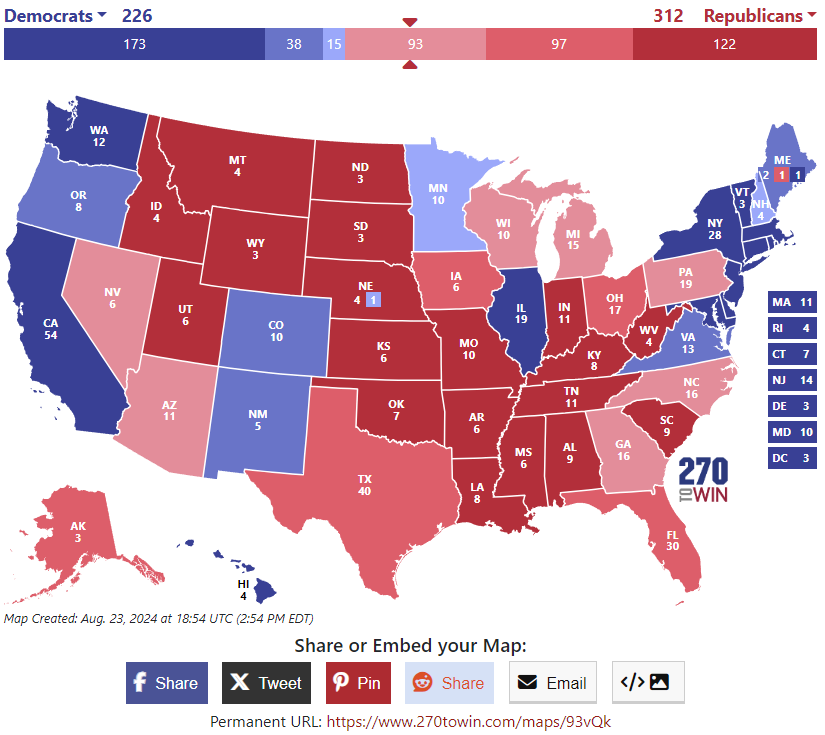
I don’t usually like to employ polls in my model. Just out of curiosity, however, I checked with Real Clear Politics once more, to compare the poll numbers today to four years ago. Their poll average shows Trump performing 3.7% better today than he did on this day in 2020. So it is reasonable to see what would happen to the electoral map if we awarded Trump all the states he won in 2020, plus the states he allegedly “lost” by less than 3.7%. It turns out that those are all the controversial swing states: all six of them. The resulting map can be seen here: https://www.270towin.com/maps/93vQk
Real Clear Politics is showing that today, Harris is leading in Wisconsin (largest margin), Michigan, and Pennsylvania (smallest margin), with Trump leading in the other swing states. Trump can afford to lose only Wisconsin and Michigan (more likely) but absolutely cannot afford to lose Pennsylvania. As I said in a previous column, Pennsylvania is the key to this election. A Harris victory there (combined with the Harris-leaning swing states WI and MI) hands her 270 electoral votes and the election. This explains all the Trump barnstorming in Pennsylvania.
I am eagerly anticipating the presidential debate between Trump and Harris. I expect that to be a gamechanger.


Kamala is the chosen one surely?
Well thought out, very interesting and informative. Thank you.