My colleague at work is a liberal professor who is proud of the achievements of Bidenomics. One of the images displayed outside her office depicts the US stock market at record highs - hooray! Let it just keep going higher and higher, like - like - a bubble, perhaps.
Is the stock market rally sustainable? For a few months, perhaps. Trading volume will decrease over the summer, especially from Memorial Day to Labor Day. Stock market indexes will be moved by small events, and large events will be magnified. My last chart on this topic was created almost 3 years ago, and I can update this if anyone wishes.
Let us examine stock market valuations and see what we discover. I got these images from https://www.multpl.com/ and from https://macrotrends.net/, together with https://fred.stlouisfed.org/.
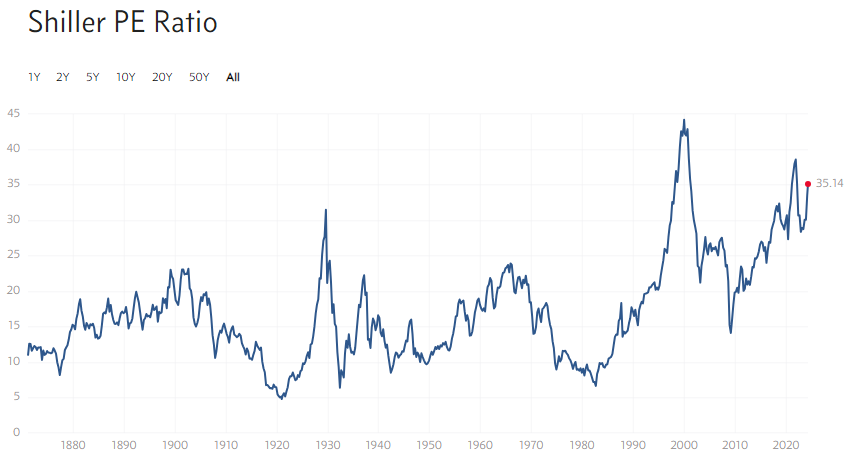
First of all, classic stock market valuation ratios: the cyclically adjusted Shiller price to earnings (PE) ratio, the price to book ratio, and the price to sales ratio.
In each case, the value of the ratio is near record highs, often close to twice the median value.
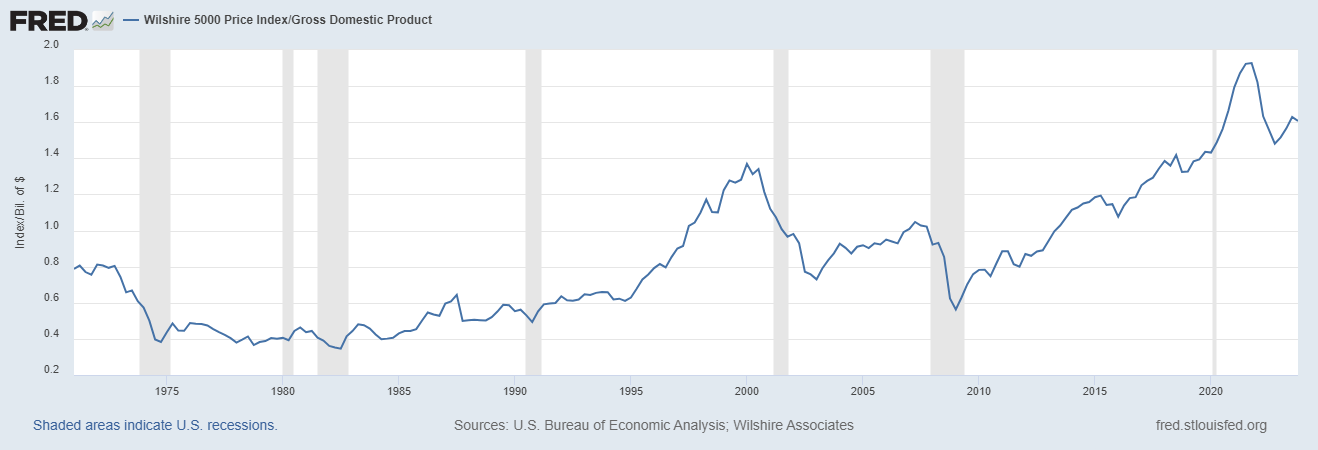
Next is the Buffett indicator: the ratio of stock market capitalization to GDP. The scale on the left side is arbitrary, but the ratio at any scale is near three times its long-term mid-range.
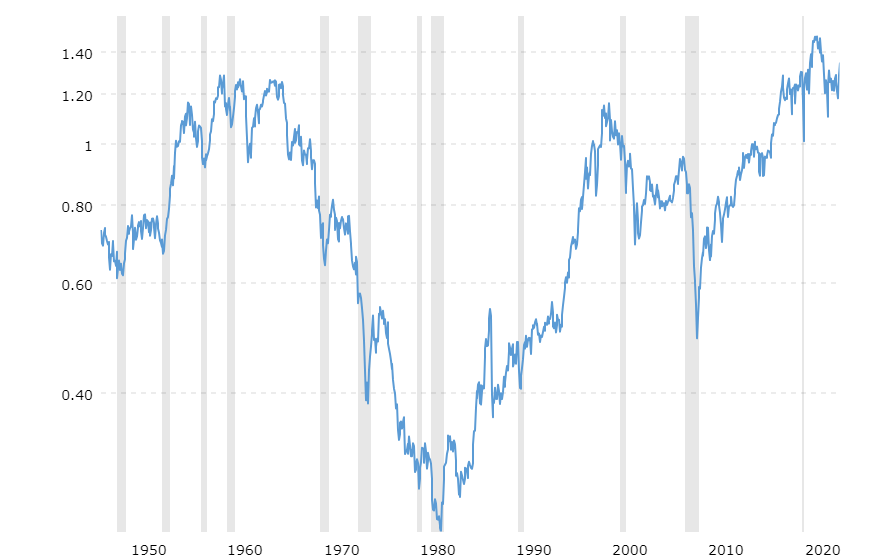
This next chart is the Dow to GDP ratio, expressing a similar concept.
All these are the types of ratios that over the long run should revert to their (geometric) means.
I am not a financial adviser, so I can only share what I am doing: taking profits on my stock ETFs, and buying investment grade bonds as long as yields are relatively high. This last is important as the Fed has indicated that they are inclined to lower interest rates later this year. That will raise prices on bonds, as older bonds with higher yields become more valuable.
I did some research on asset allocation in portfolios with varying degrees of risk tolerance, based on about 48 years of data. Now I realize that this research must be updated with information about inflation as well. In any case, I found in my earlier study that even my most conservative portfolio had 12.5% in gold, 16.5% in US stocks, and 71% in US bonds. (I did not have access to long-term data about international stocks and bonds; perhaps next time I may find more data.)


What Goes Up, Must Come Down
My father told me, “money grows legs and walks away on you.” He had done some modest investing in the stock market after the war but bailed out at the bottom of the market towards the end of the decade, when I was born. Just know that everything to do with money is full of deception. When I started my own career, my mentors said, “you can’t become rich working with your hands; make your savings work for you”. As I progressed, a continuing education lecturer said, “in the market, you never know whether your next move is the smartest or the stupidest; it is always one or the other”.
The problem with retail investing (without inside knowledge of the business) is lack of accurate information; if it were accurate, you wouldn’t have to contend with “stupid moves” (tending toward self-destruction). But every investor makes errors, and if you don’t examine why you lost money you will be condemned to repeat the mistake, because when conducting learning by trial and error (which is all learning), the education lies in the error, not the success. When you repeat the error, you will know it and gnash your teeth for your incompetence; when you succeed at investing, you attribute that to how smart you are and become vain and arrogant. Therefore in investing, as in all things, it is better to be humble and grateful for your loss, which is the fee for your lesson. In investing, like learning arithmetic, no one can teach it to you. You must teach it to yourself.