

Silver and gold
Not barbarous relics

Do you remember the movie “The Gods Must Be Crazy”? Now I think the financial markets must be crazy. They are giving off mixed signals. Warning: this post will be filled with graphs.
Let’s begin with the numbers that drive so much of US economics and financial markets: US money supply (green), federal debt (red), and GDP (blue). Ideally, both the green and red lines should remain well below the blue line. What do you notice?
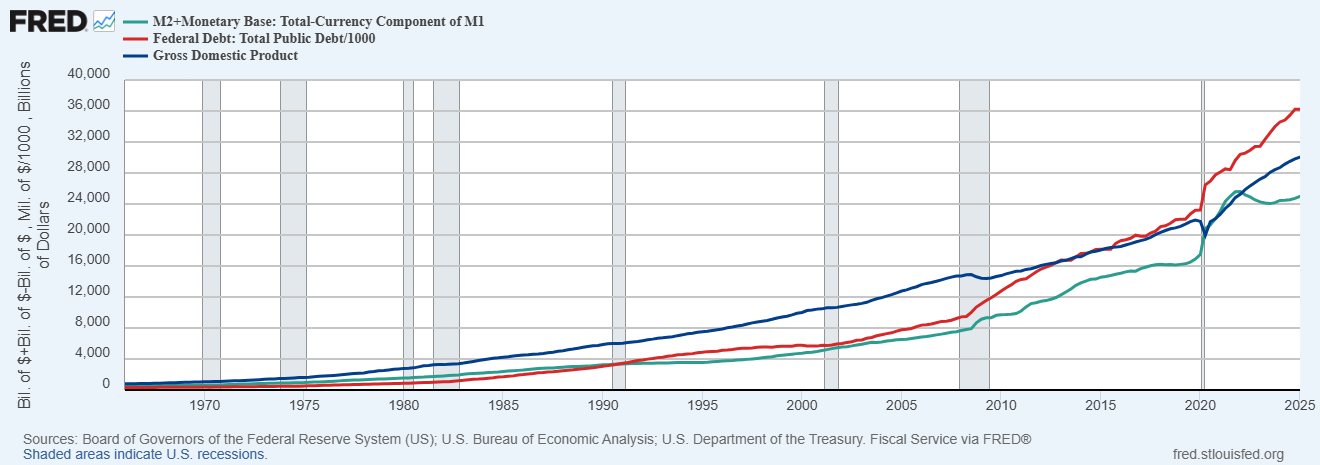
Money supply has jumped only recently; it has subsided once more below GDP, but is still too high. In contrast, debt is clearly out of control. We can argue whether government revenue is too low, or whether spending is too high, but in either case, we cannot afford our current lifestyle, and are borrowing money from our children, our grandchildren, and foreigners to pay for what we like today.
Although interest rates can come down slightly, very low interest rates will not be enough to attract investors concerned about risk. This is part of what is driving up the price of silver and gold. However, the appropriate targets for precious metals and for stocks is not obvious.
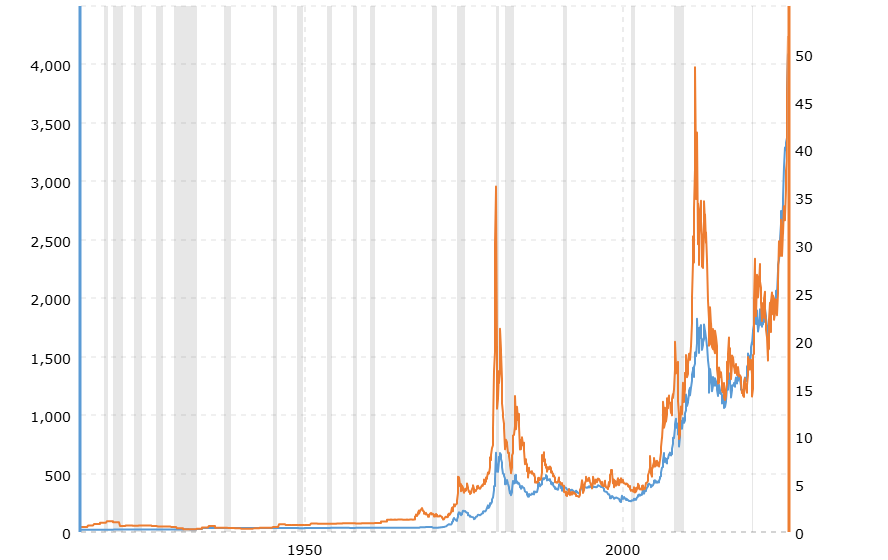
The following shows historical prices for silver (pumpkin) and gold (blue), thanks to Macrotrends. Note the very sharp spikes and collapses for silver, far more volatile than gold.
Interestingly, according to Infinite Market Cap, gold represents the single largest investable asset on earth, at about $30 trillion, whereas world stocks have a total of about $134 trillion in value. For a capitalization-weighted investor, this implies that gold should represent a significant fraction of your portfolio.
Where are we in the stocks-gold cyclical relationship? The answer is: somewhere in the middle. My graphs below are based on more data from Macrotrends. The first shows the price of the S&P 500 index per ounce of gold (the natural logarithm of this ratio).
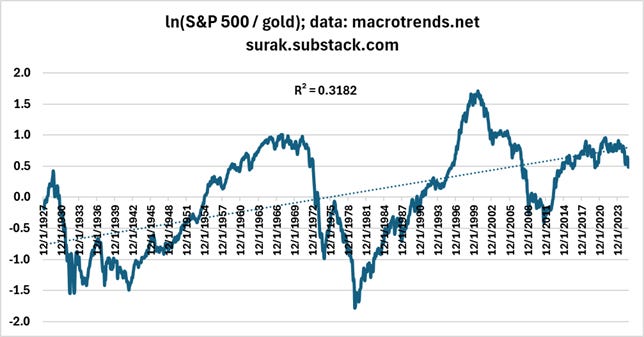
There is a significant exponential trend in the ratio, reflecting the fact that equities appreciate faster than gold. There is also a cyclical component in the data. When we subtract out the trend, we get the following graph.
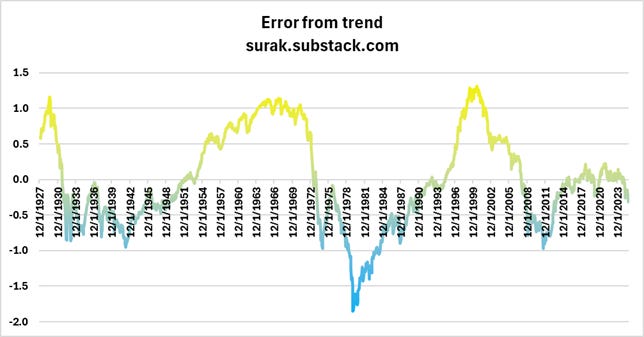
In the upper part of the graph, stocks are too expensive; it is better to sell them and buy gold. In the lower part of the graph, stocks are too cheap; it is better to buy them and sell gold. Currently, we are in the middle, with no obvious direction for the last 11 years. So - hold both?
There is abundant data on the current valuation of US stocks, and it is not encouraging at all. This data comes from Multpl (yes, that is the correct spelling). The following graphs depict three ratios for the S&P 500: the Shiller cyclically adjusted price-earnings ratio; the price-book ratio; and the price-sales ratio.
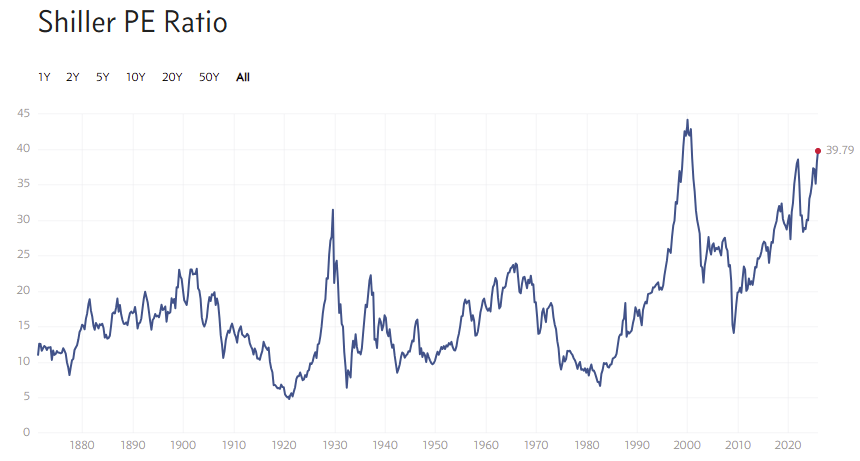
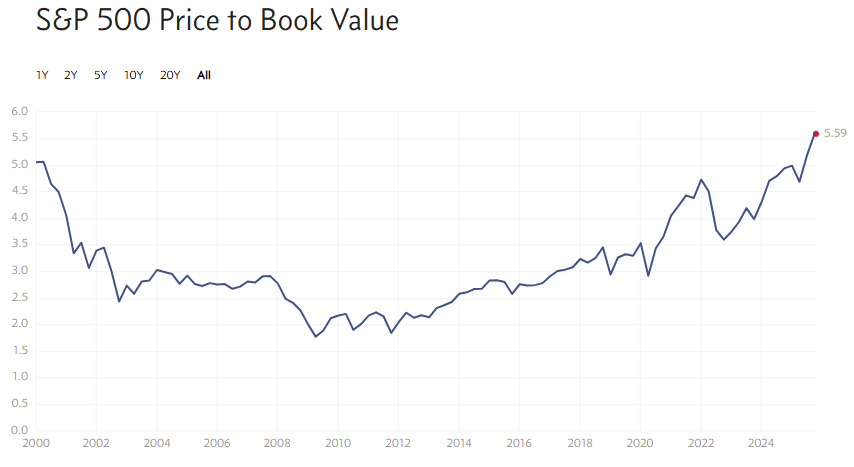
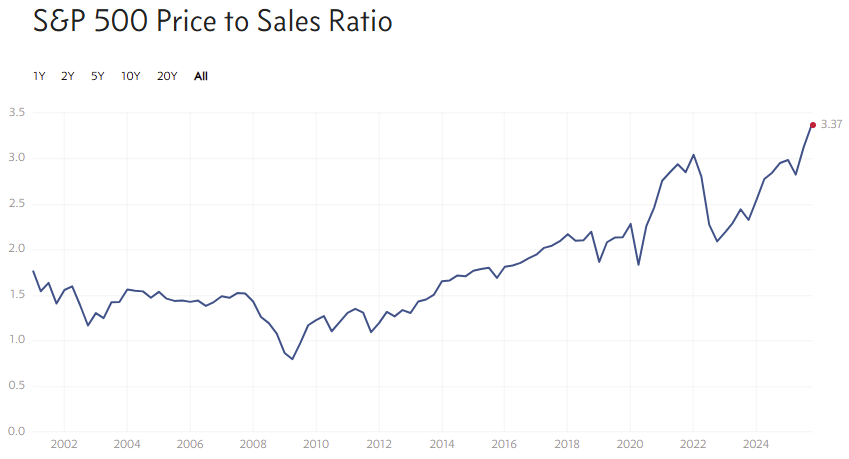
All graphs suggest that stocks are the most overvalued they have been in about 25 years. It would take incredibly good earnings reports in the next few weeks to justify these prices.
On the other hand, gold prices are supposed to be inversely related to real interest rates. Here is the real (inflation-adjusted) yield on the 10-year US Treasury note (also from Multpl).
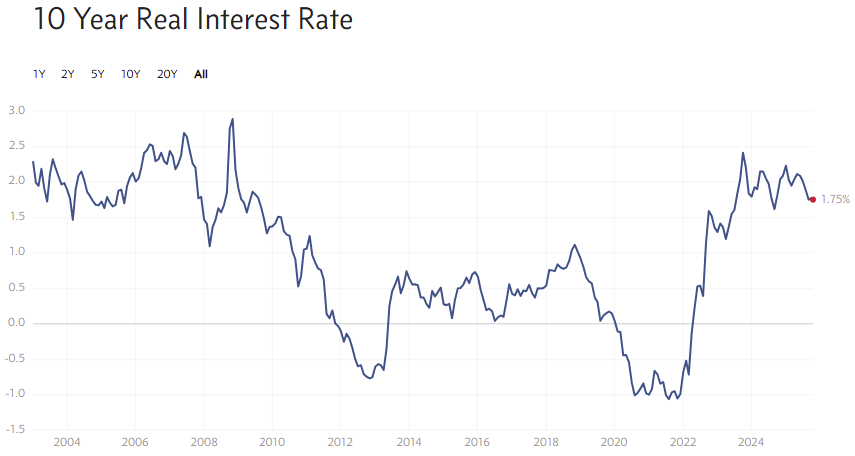
With real yields as high as they are, why is gold performing so well?
There is a little bit of good news from the US Treasury department. It seems that they have been able to reduce the deficit substantially in recent months, thanks to controlling spending, and tariff revenues.
I present you my data with the hope that some of my readers will be able to educate me.
I am, in all honesty, not an expert in financial markets or their strengths or weaknesses. The recent and present spike in gold price (and silver price), I believe, is not a reflection of the value of these commodities. Rather it is an indication of the value (purchasing power) of the dollar. As the dollar continues to lose its value (don't forget, the dollar is backed only by the faith and credit of the US government), it simply costs more of these devalued dollars to purchase gold. I believe that the low value of the dollar is partially responsible for the high prices (valuation) of stocks, and, the low interest rate of US bonds (IOUs). Stock values also reflect the ability of companies to borrow money. As the consumers' ability to borrow declines (we are, like the government, way over-extended), the banks will look to the companies to borrow more. As you (or at least, me) can see the whole financial picture is presently very vicarious. My advise, for what it's worth as a non-expert) is to limit investments (maybe sell while the prices are high if you're heavily invested) and also trim down what you have saved in banks. Don't forget, it is, by law, no longer your money, but a loan to the banks. Additionally, they are paying zilch for interest. Other than the fake, shaky crypto coins, it seems that the only wise investment today, and the safest, is gold. After gold, silver (which according to Surak's chart is not as stable as gold) is the next best investment. The financial system cannot function very long in this shaky condition. Beware, many "experts" are predicting a total financial collapse. Buy gold to survive. Also, just in case, consider "investing" in quality firearms and common calibers of ammo.
The only advice I can give is to quote an old management saying “What gets measured gets managed” but I would also add that the most accurate saying should be “what gets measured gets manipulated”