

Would you like some cholesterol with your meal?
It might help

I recently saw my cardiologist, and shared some new research with her. If you read two of my previous articles, you can imagine how that discussion went.
The cholesterol hoax

Cholesterol, that scary word. It makes up a significant portion of our cell walls and our brains. In other words, if we emptied our bodies of all cholesterol molecules, we would be puddles of water on the floor.
The relatively new research was discussed in detail in this article. The authors summarized studies that took place in Britain and in China, involving hundreds of thousands of participants. They were prospective studies, which are higher quality. This means the participants are observed from the beginning of the study, as opposed to a retrospective study, in which survivors are asked about their habits. All participants were late middle-aged to early seniors, and none took cholesterol-lowering medication (like statins).
The participants were followed up with after about 10 years. The authors were most interested in death from coronary heart disease (CHD); death from cancer; and death from any cause (all-cause mortality). The authors were most curious about the association of these three outcomes with four proposed predictors: total cholesterol; HDL; LDL; and non-HDL cholesterol.
What do you think the results were? We have been taught that cholesterol is a killer. My mother was so proud of her total cholesterol level of 125 - right before she died from cancer. You will understand why when you see the charts below.
Figure 1 summarizes the most important results of the paper. I will break it down in detail.
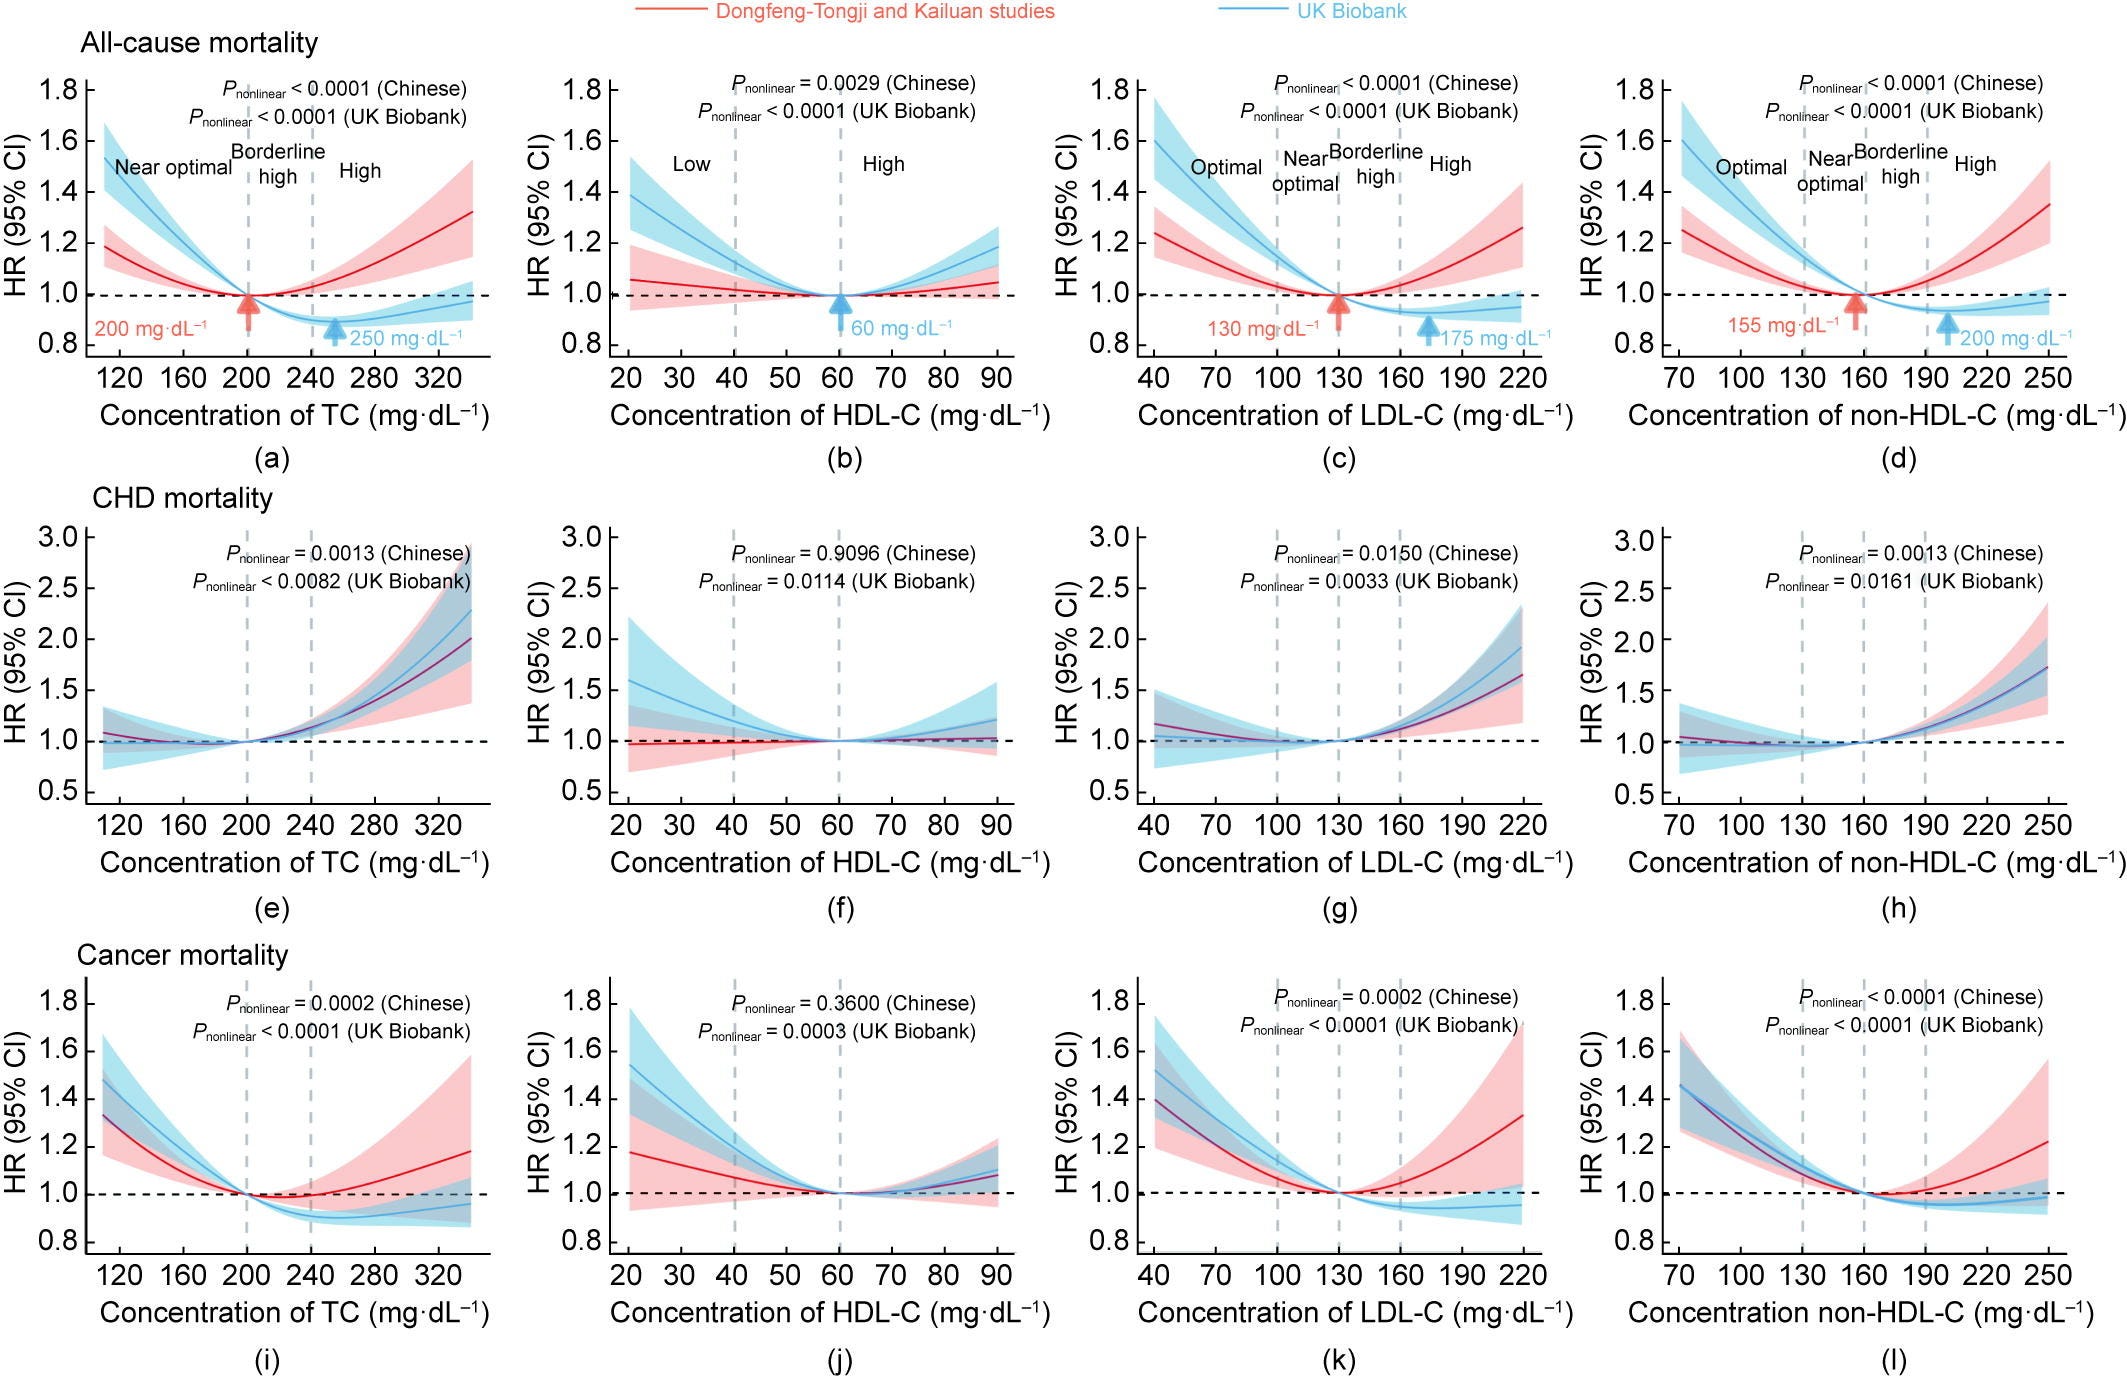
The twelve graphs show every possible combination of every proposed predictor (subdivisions of cholesterol) with every outcome of interest (mortality from various causes). Within each graph, the red curve and band represent the Chinese patients; the blue curve and band represent the British patients.
The most important graph is the one in the upper left: all-cause mortality as a function of total cholesterol. Understanding it is key to the remaining graphs.
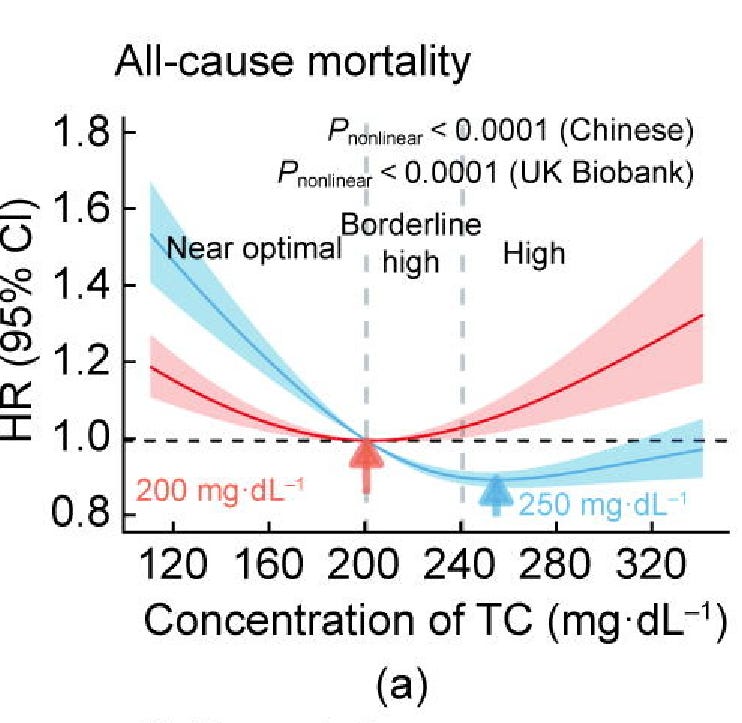
The horizontal axis represents the level of total cholesterol. The vertical axis represents the hazard ratio (HR). This is the risk of observing a specified event (in this case, death from any cause) as a multiple of the risk at a certain specified control point. In this case, the specified control point for total cholesterol (TC) was 200, because we have been taught that levels above 200 are dangerous.
Based on the dominant narrative around cholesterol, one might expect to see graphs with curves sloping up to the right. This would imply that higher cholesterol is riskier (more deaths), and lower cholesterol is safer (fewer deaths).
What do we actually see? The red Chinese and blue British graphs are both U-shaped. You can also see that characteristic shape throughout most of the other components of figure 1.
The U-shape implies that high cholesterol is indeed risky, but so is low cholesterol. To minimize the risk of dying, you would prefer to be at the lowest point on the curve. For the Chinese cohort, that is where TC = 200. For the British, that is where TC = 250, much higher than the 200 they tell you to achieve.
Regarding HDL, both cohorts minimized all-cause mortality at HDL = 60. Regarding LDL, the Chinese optimal level was 130 and for the British, it was 175. That 175 is significantly higher than the 100 the statin manufacturers doctors want you to achieve.
You can imagine how shocked my cardiologist was to see these numbers. She tried again to convince me to take a low dose statin because my LDL was too high, in her opinion (it is in the 110s). She said that statins are safe (I did not argue that point with her, even though I did not agree). She hoped to reduce my risk of cardiovascular mortality - at the price of increasing my risk of cancer mortality far more!
I would like to bring my HDL up to the 50s, and my LDL to the low 200s. I am edging towards going more paleo-pegan, reducing sweets and starches substantially. I am happy to be living near a traditional culture rural area, with several organic farms and robust people.
We are already doing well with vegetables and fruits, I think. According to my research, the most healthful foods in the plant kingdom are avocadoes and cruciferous vegetables (broccoli, Brussels sprouts, cabbage, cauliflower). More walking in the sun could only help.
L’chayim (to life)!
DISCLAIMER: I am not a physician giving medical advice. I am sharing what I have learned for educational purposes. Consult a healthcare practitioner with questions.
I know so many people who are prescribed statins, and once on them they are almost addicted. They then start taking blood pressure measures every day and this causes an increase in anxiety which increases blood pressure and on an on it goes.